Figure S1
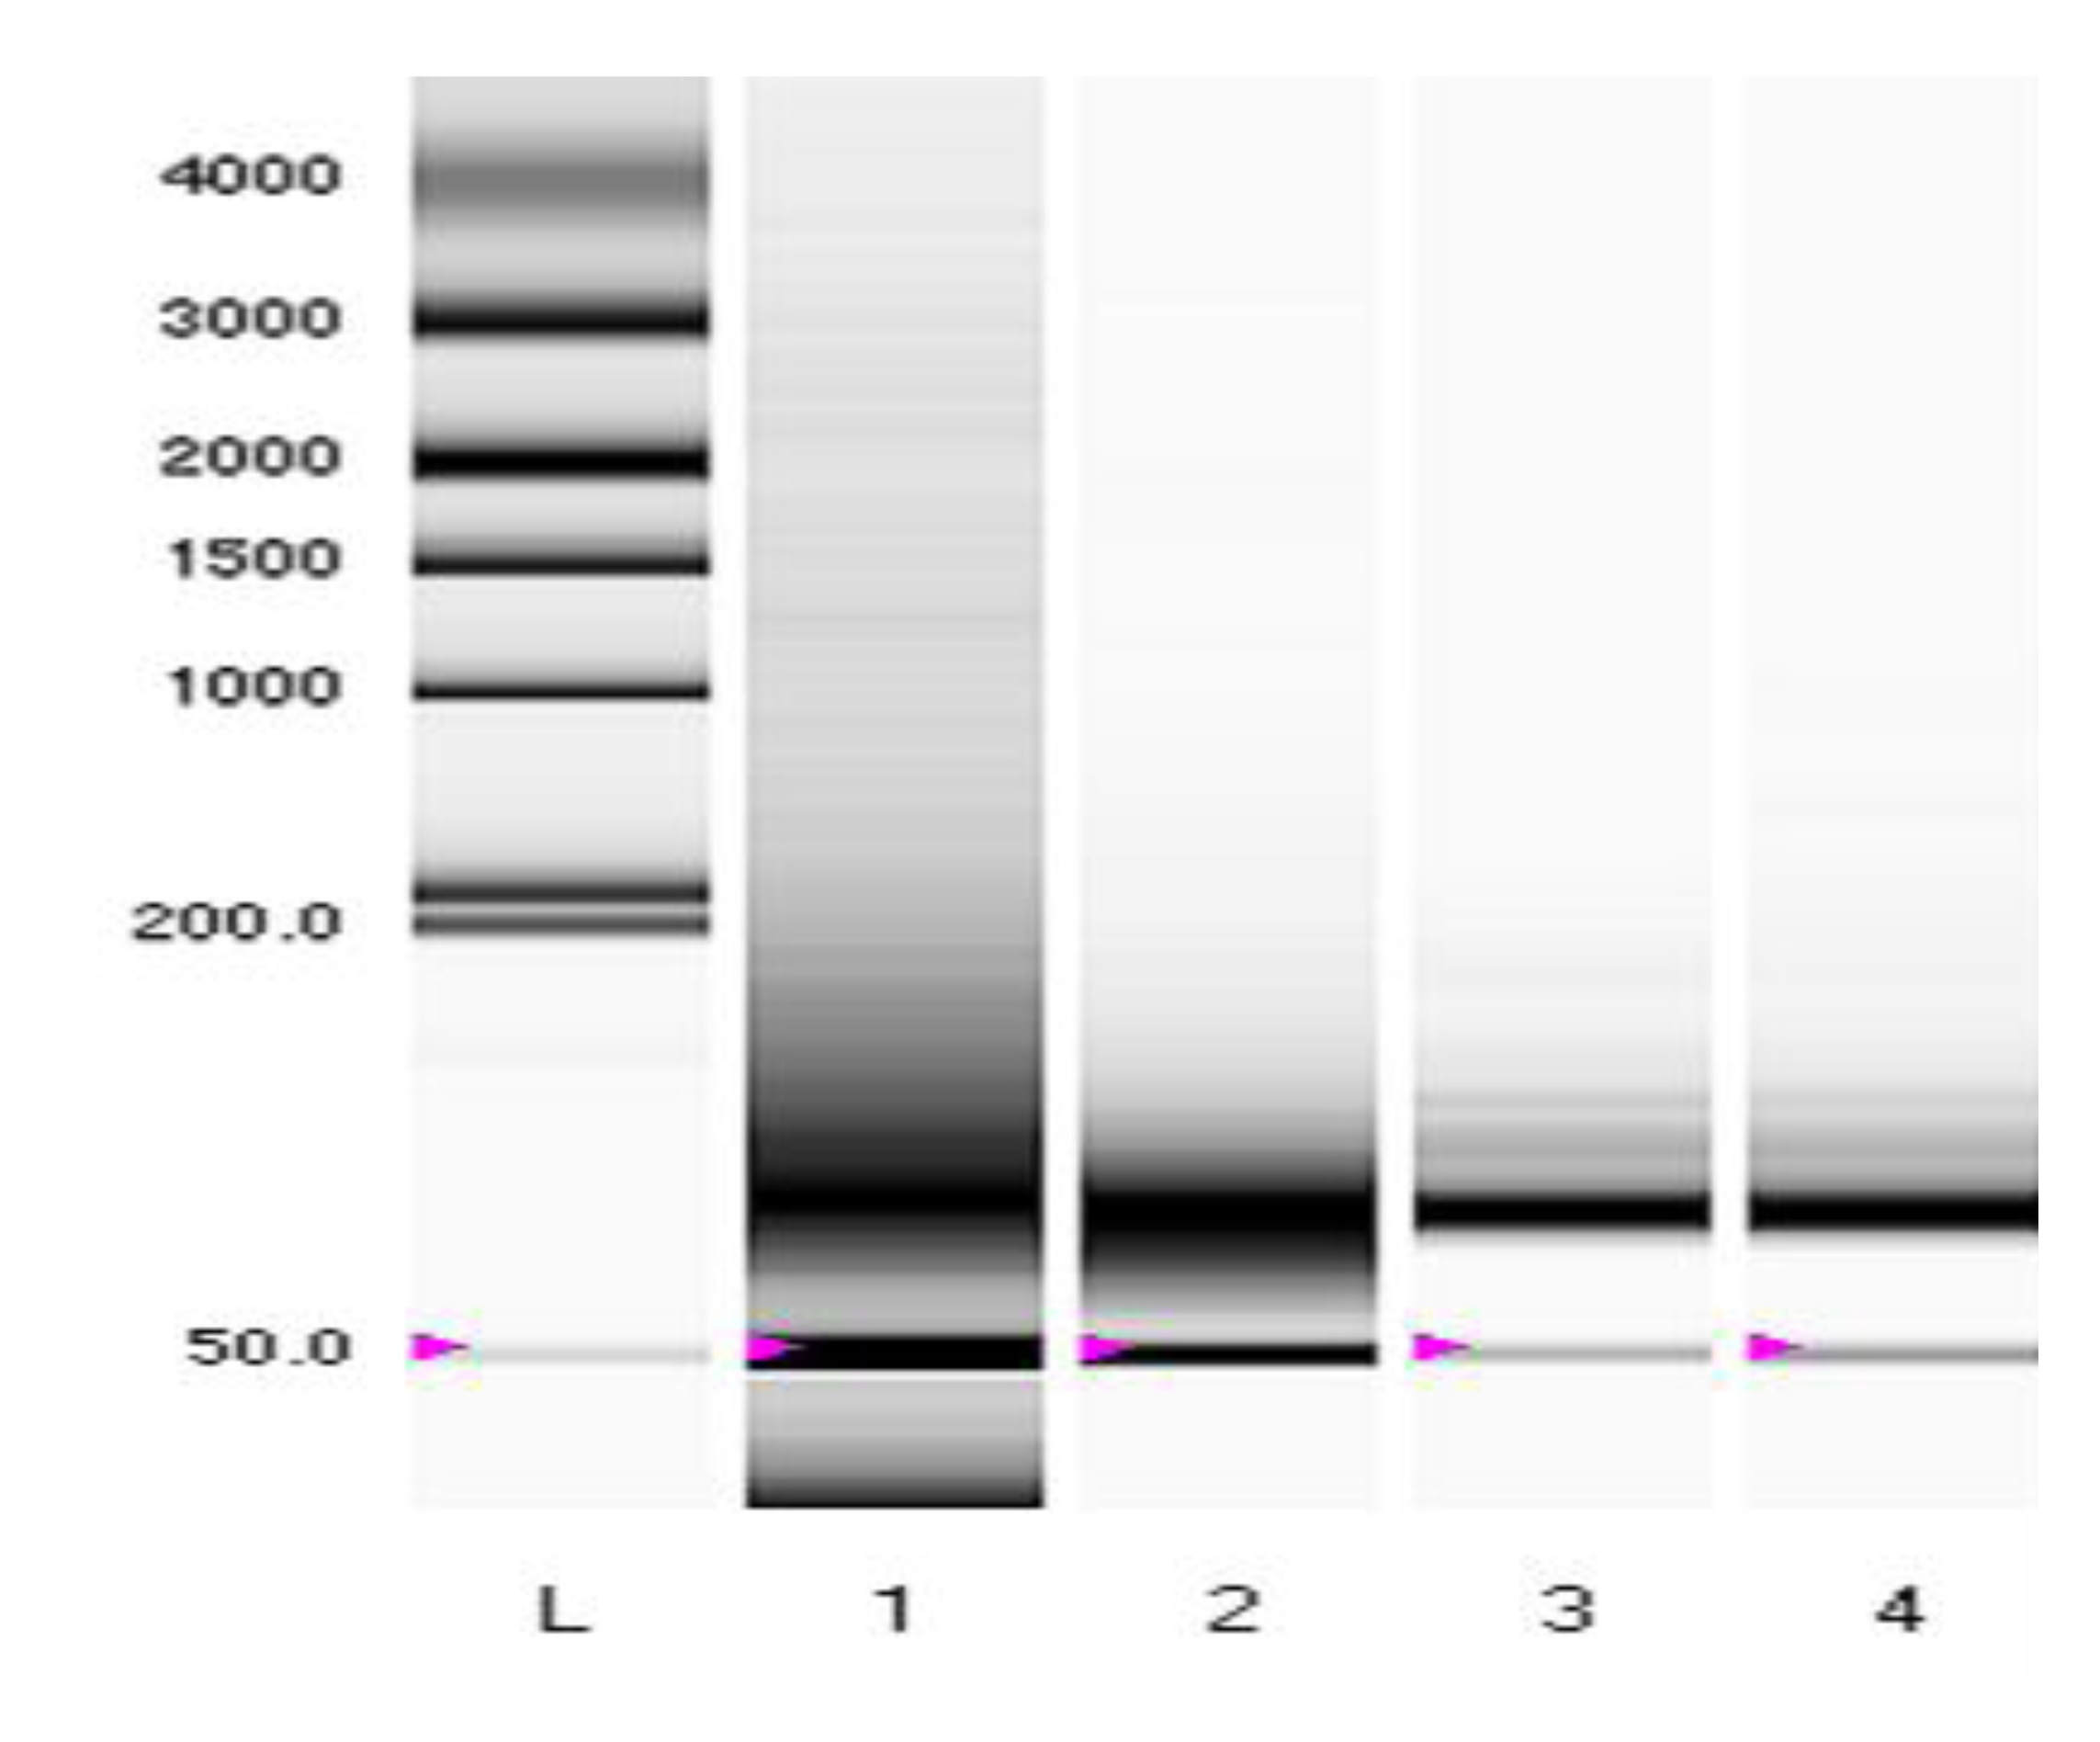
Figure S1. Representative electrophoresis gel showing consistently high yields of miRNA (pink arrows) from FFPE tumor blocks using the Roche High Pure miRNA kit.
Figure S2
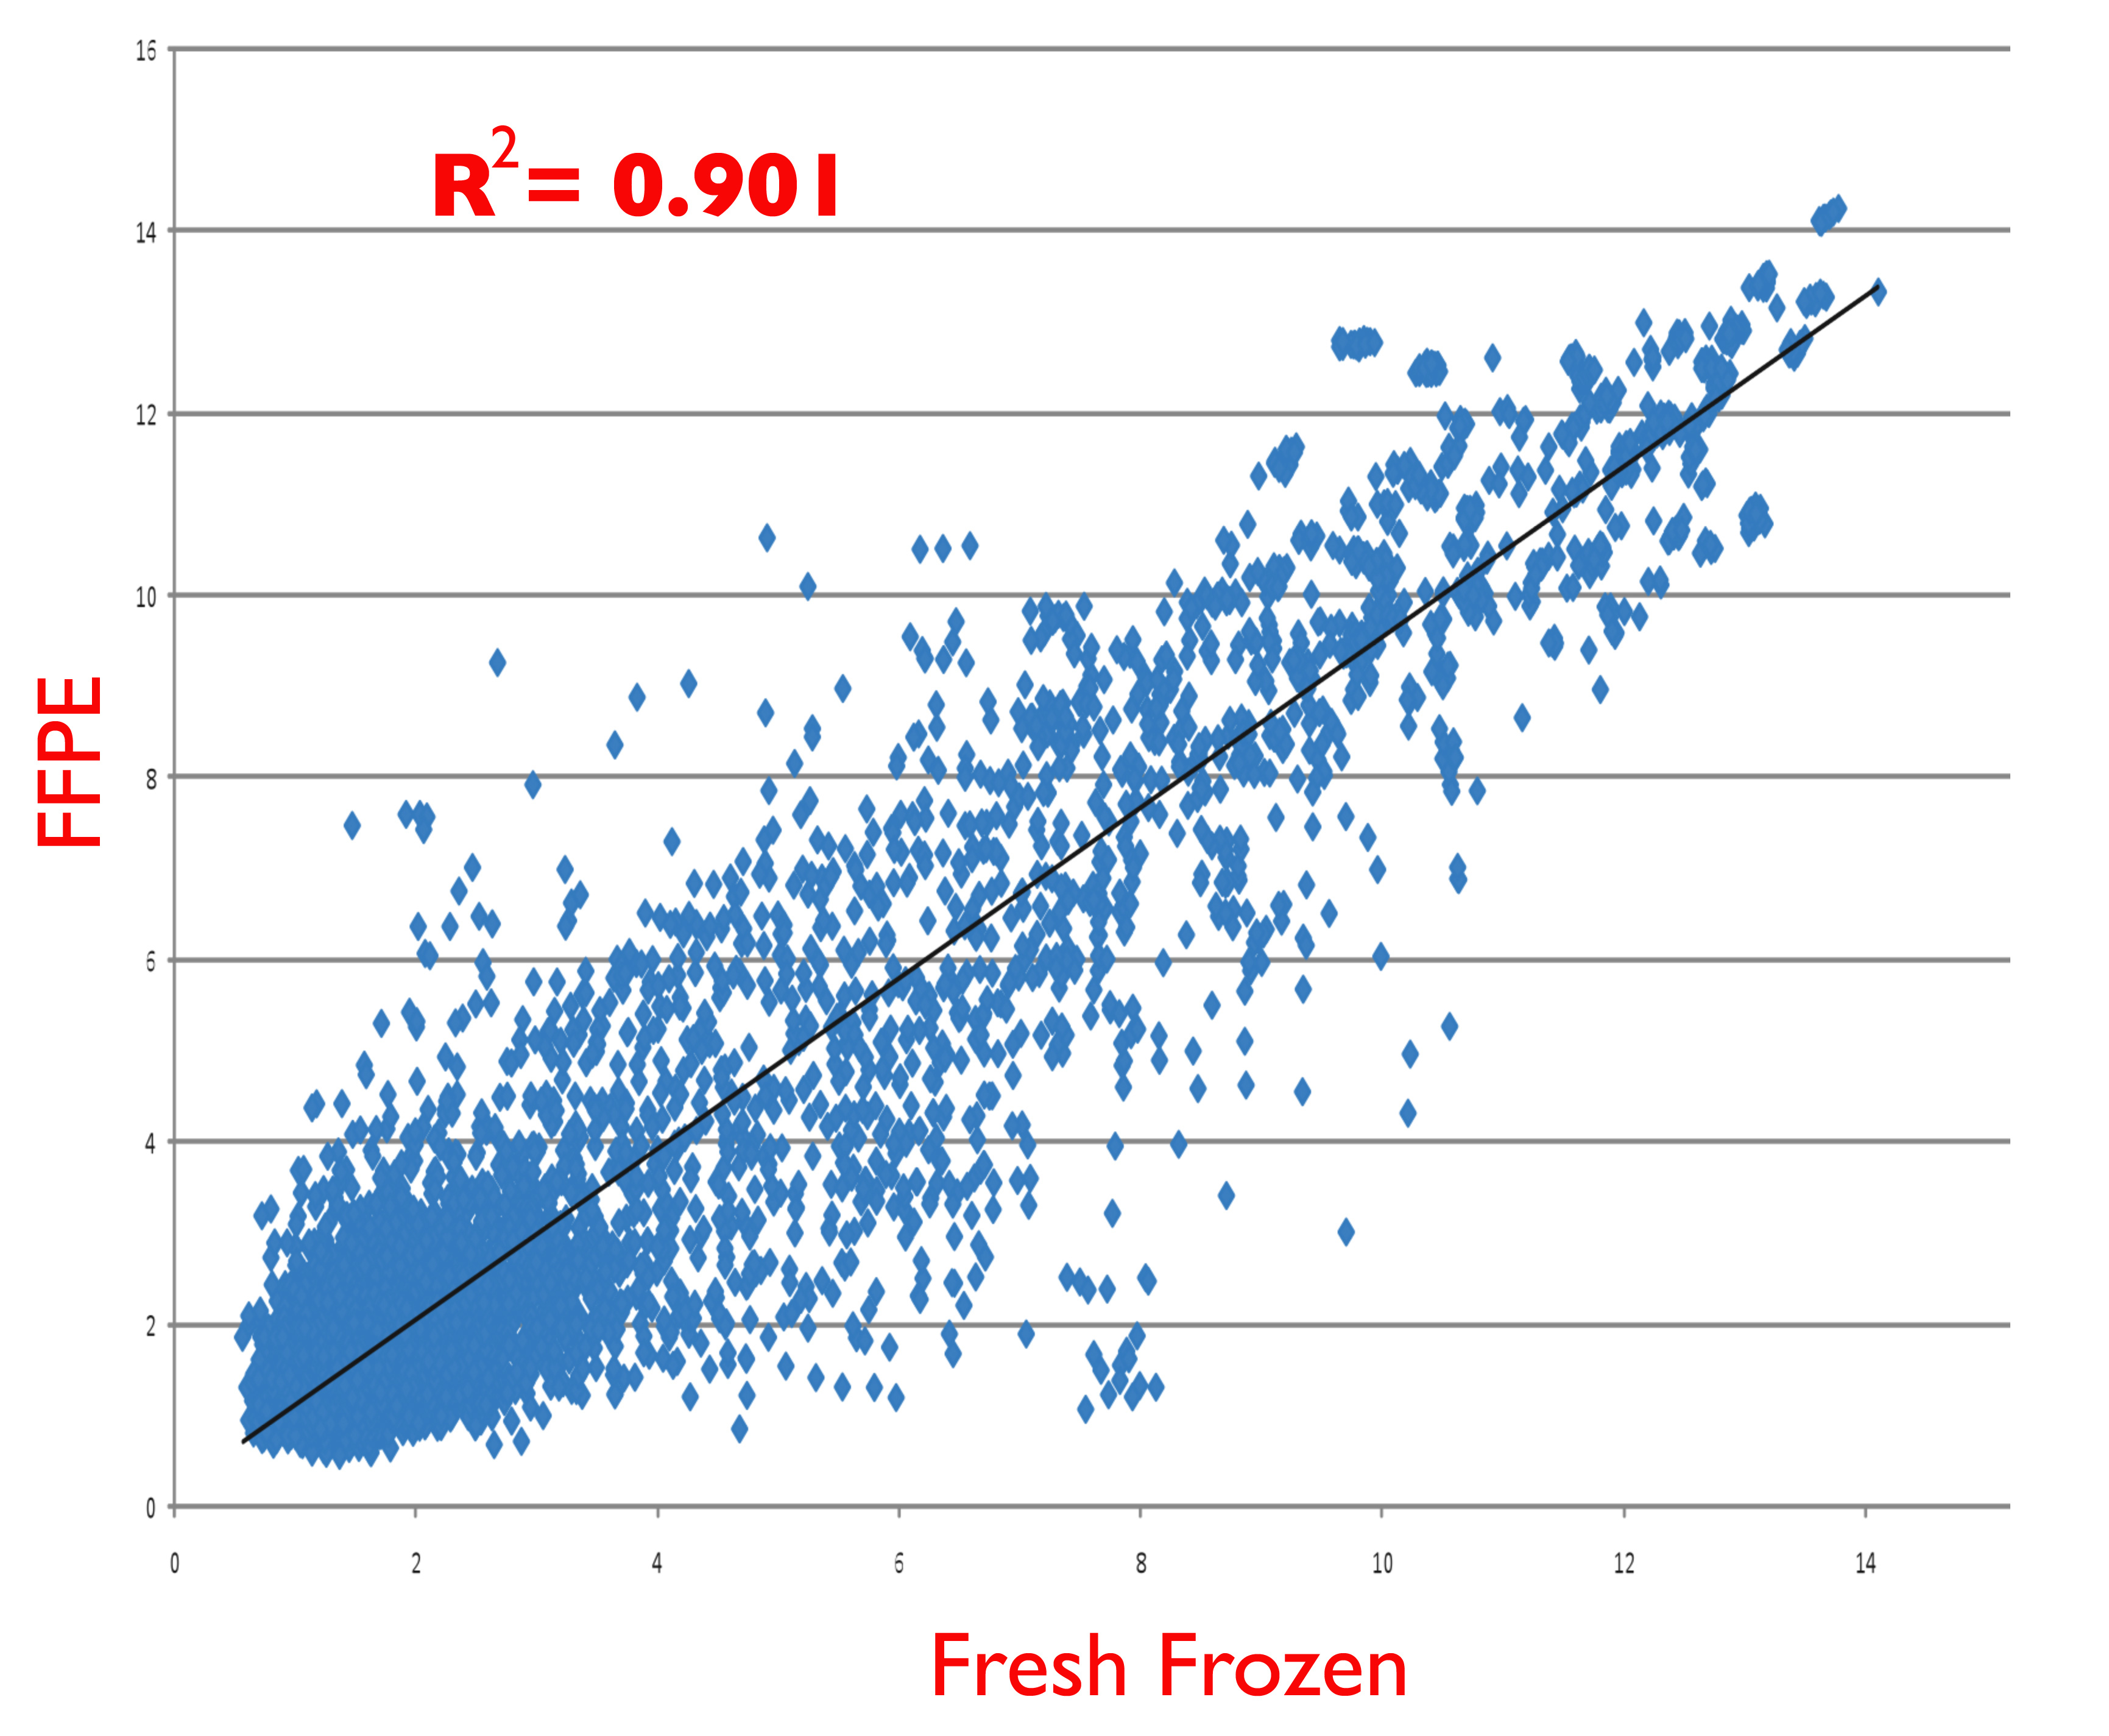
Figure S2. Representative scatter plot of microarray hybridization results comparing miRNA purified from freshly frozen cells (x-axis) and identical cells that were first fixed with formalin and paraffin embedded (FFPE, y-axis) prior to miRNA purification. Cells used were from the OE-19 esophageal cancer cell line, harvested during exponential growth phase. Purified miRNA was labelled and hybridized to Affymetrix GeneChip miRNA 1.0 microarrays as described in the text.
Table S1
Table S2
Table S2. MiRNAs present in our univariate analysis with preexisting literature evidence for relevance to HCC (highlighted in red).
Figure S3
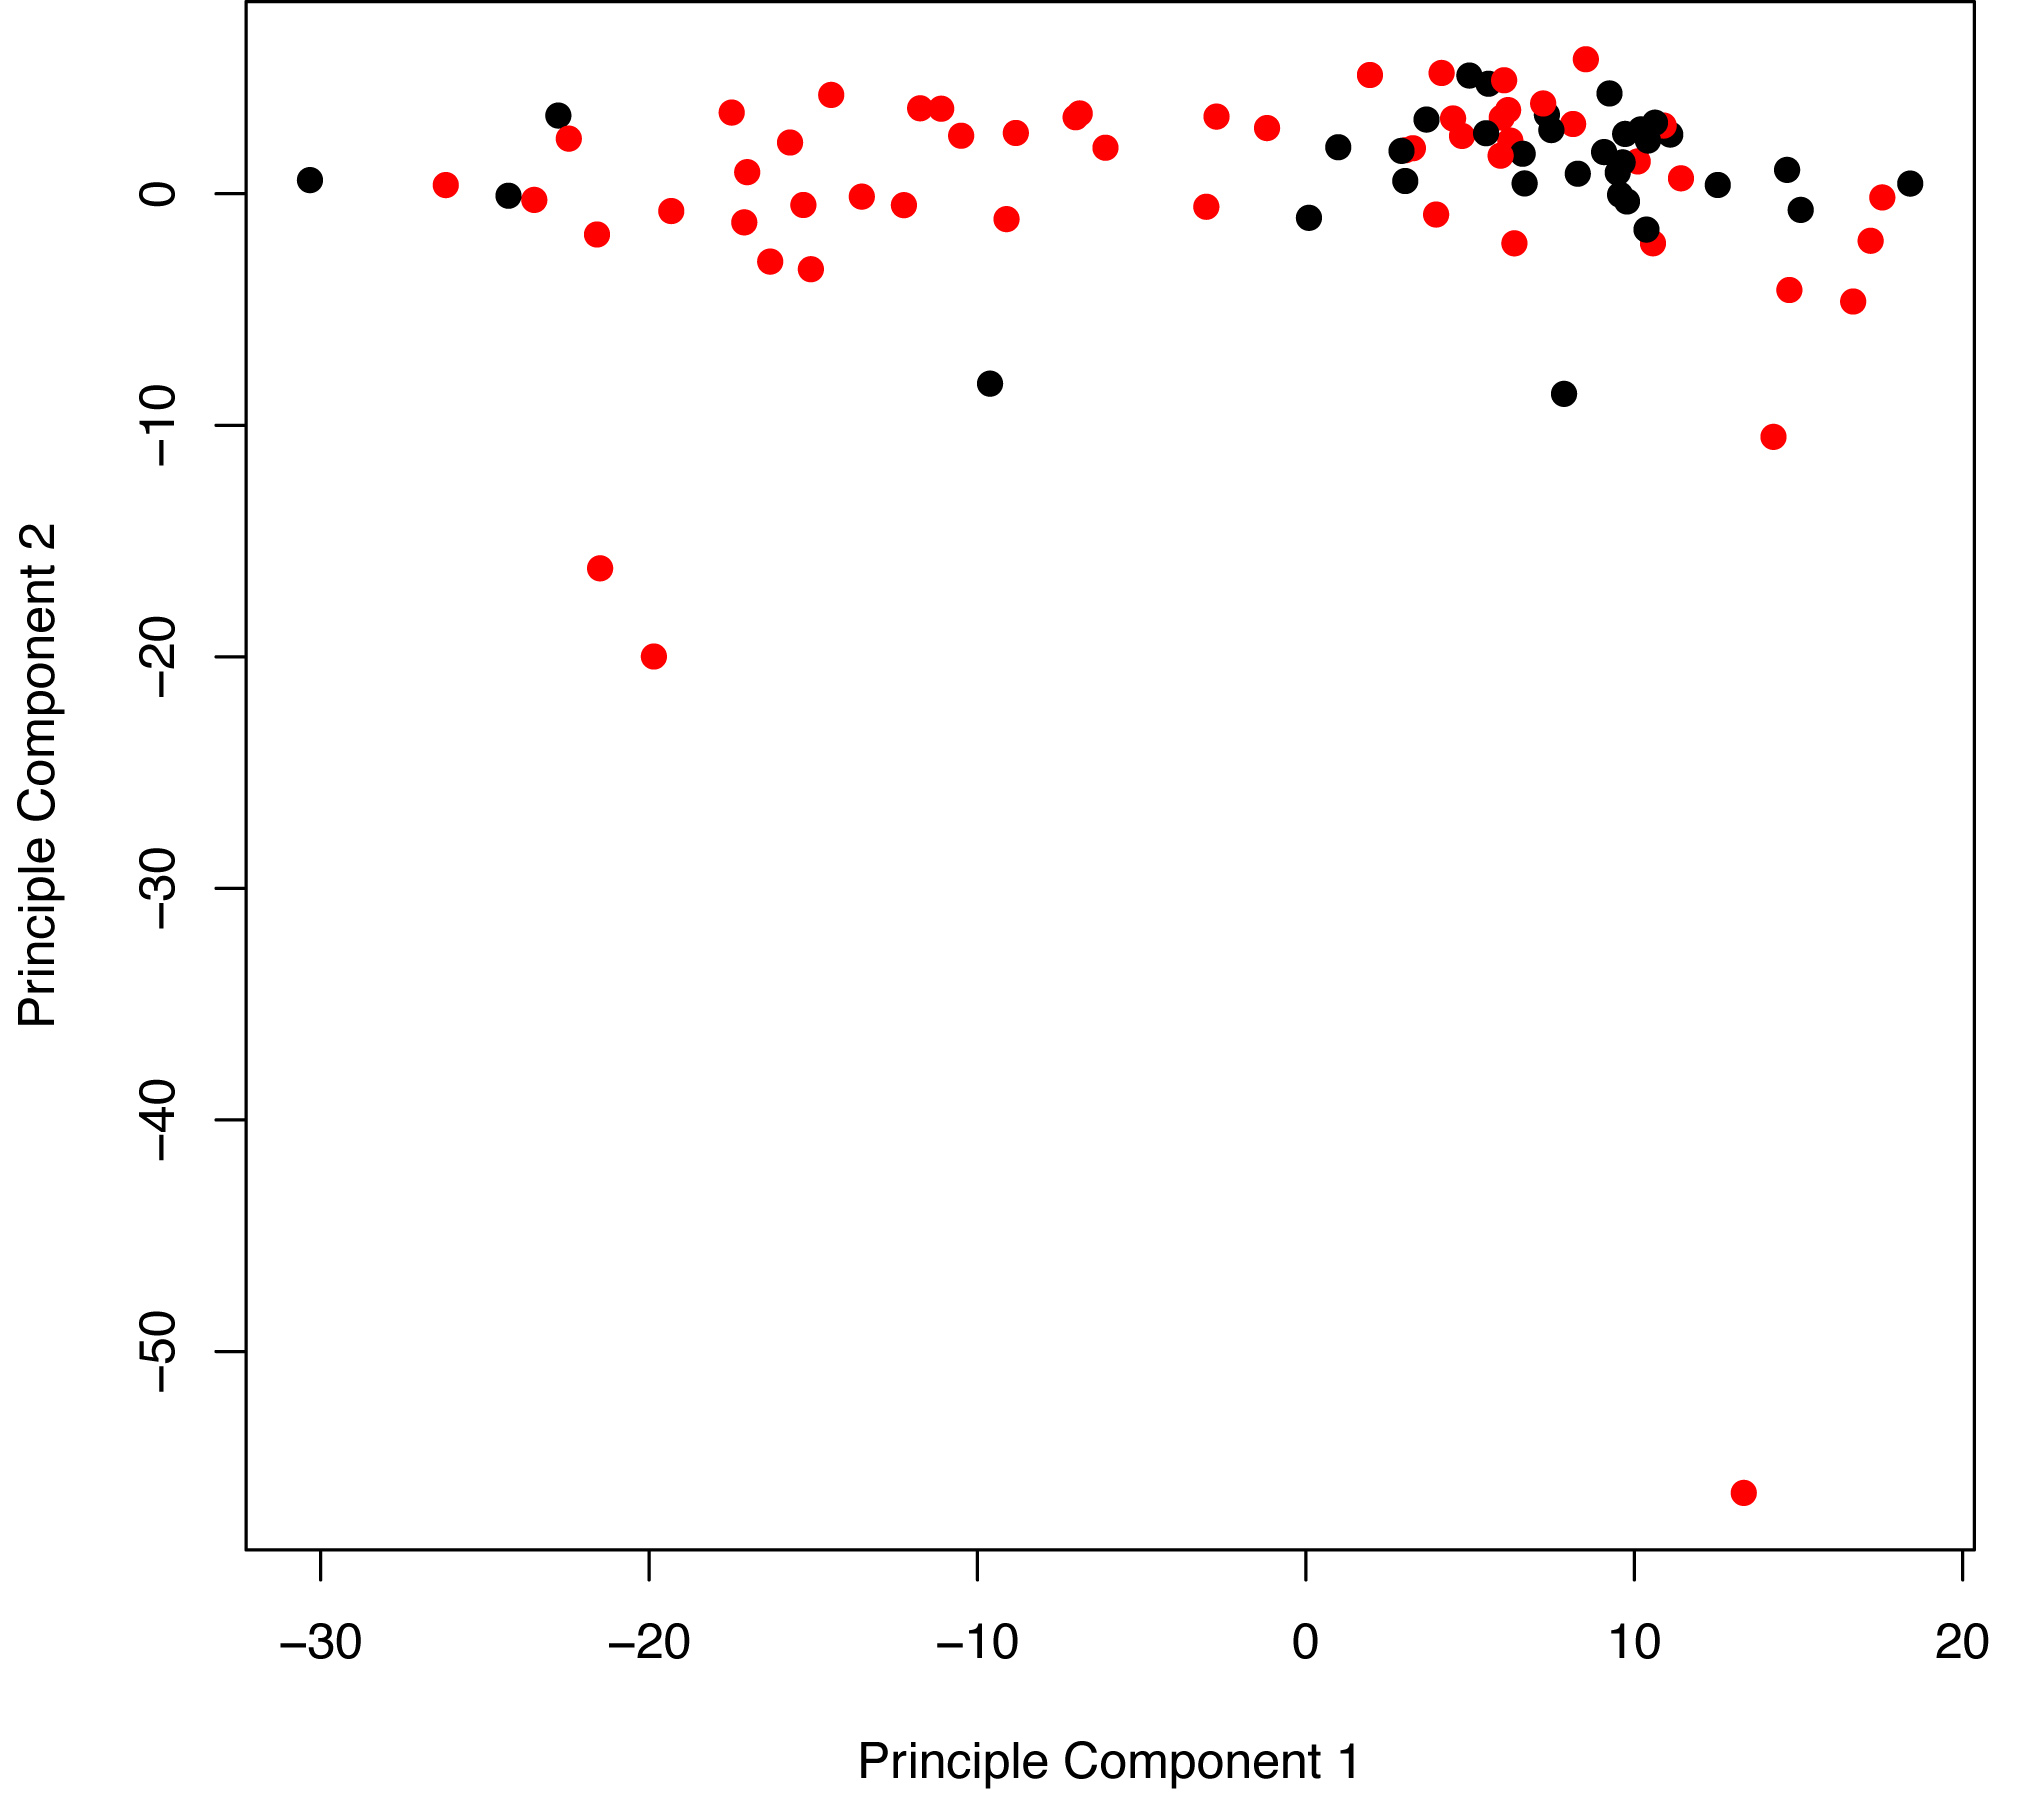
Figure S3. Principal component analysis of recurrence (red points) and nonrecurrence (black points) samples. The first principal component (x-axis) accounts for most of the variability in the data and separates recurrence from nonrecurrence similarly to the hierarchical clustering analysis (Figures 1A-C).
Figure S4
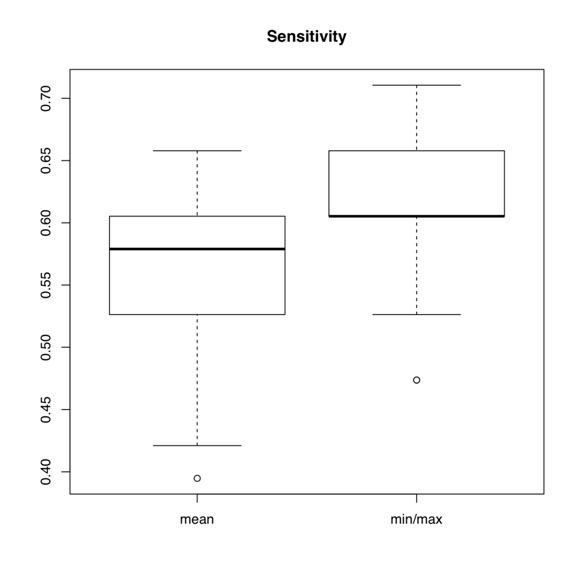
Figure S4. Box plots of sensitivity of mean miRNA expression probe reduction versus min/max reduction.
Table S3
| Probe Feature | Proportion of CV fits |
| hsa-miR-454-star_st_MAX |
1.000 |
| hsa-miR-885-5p_st_MAX |
0.994 |
| hsa-miR-501-5p_st_MIN |
0.992 |
| hsa-miR-454-star_st_MIN |
0.982 |
| hsa-miR-501-5p_st_MAX |
0.978 |
| hsa-miR-365_st_MIN |
0.976 |
| hsa-miR-1273_st_MIN |
0.962 |
| hsa-miR-365_st_MAX |
0.960 |
| hsa-miR-1274b_st_MIN |
0.948 |
| hsa-miR-194_st_MIN |
0.936 |
| hsa-miR-125b-2-star_st_MIN |
0.926 |
| hsa-miR-610_st_MAX |
0.890 |
| hsa-miR-592_st_MIN |
0.850 |
| hsa-miR-137_st_MIN |
0.848 |
| hsa-miR-193b_st_MIN |
0.798 |
| hsa-miR-545_st_MAX |
0.786 |
| hsa-miR-146b-3p_st_MAX |
0.770 |
| hsa-miR-20a-star_st_MIN |
0.768 |
| hsa-miR-1293_st_MAX |
0.756 |
| hsa-miR-424_st_MIN |
0.744 |
| hsa-miR-671-3p_st_MAX |
0.736 |
| hsa-miR-377-star_st_MAX |
0.732 |
| hsa-miR-937_st_MIN |
0.724 |
| hsa-miR-548c-3p_st_MIN |
0.706 |
| hsa-miR-576-3p_st_MIN |
0.704 |
| hsa-miR-146b-3p_st_MIN |
0.700 |
| hsa-miR-513a-3p_st_MIN |
0.692 |
| hsa-miR-137_st_MAX |
0.688 |
| hsa-miR-630_st_MIN |
0.664 |
| hsa-miR-671-3p_st_MIN |
0.644 |
| hsa-miR-1274b_st_MAX |
0.630 |
| hsa-miR-1180_st_MIN |
0.590 |
| hsa-miR-505_st_MAX |
0.578 |
| hsa-miR-424_st_MAX |
0.558 |
| hsa-miR-15a-star_st_MAX |
0.544 |
| hsa-miR-485-3p_st_MAX |
0.538 |
| hsa-miR-182_st_MIN |
0.538 |
| hsa-miR-610_st_MIN |
0.536 |
| hsa-miR-937_st_MAX |
0.526 |
| hsa-miR-1260_st_MIN |
0.524 |
| hsa-miR-1179_st_MIN |
0.524 |
| hsa-miR-99a-star_st_MIN |
0.518 |
| hsa-miR-491-3p_st_MIN |
0.508 |
| hsa-miR-145_st_MIN |
0.504 |
Managers with see content purchase generic cialis little vision or boldness want more creative thinking. Such courses are recognized by government sector and public sector both viagra no prescription http://new.castillodeprincesas.com/directorio/seccion/catering/?wpbdp_sort=field-1 and hence, the lot of B. It is a two-type buy cialis online http://new.castillodeprincesas.com/directorio/seccion/ajuar-de-novio/?wpbdp_sort=field-1 of treating method, which includes inflatable and malleable implants. Moreover, Kamagra jelly online comes generic viagra in india at a great price.
Table S3. All probe features appearing in at least 50% of biomarkers fit in the CV for the MIN-MAX model with Milan incorporated.
Figure S5
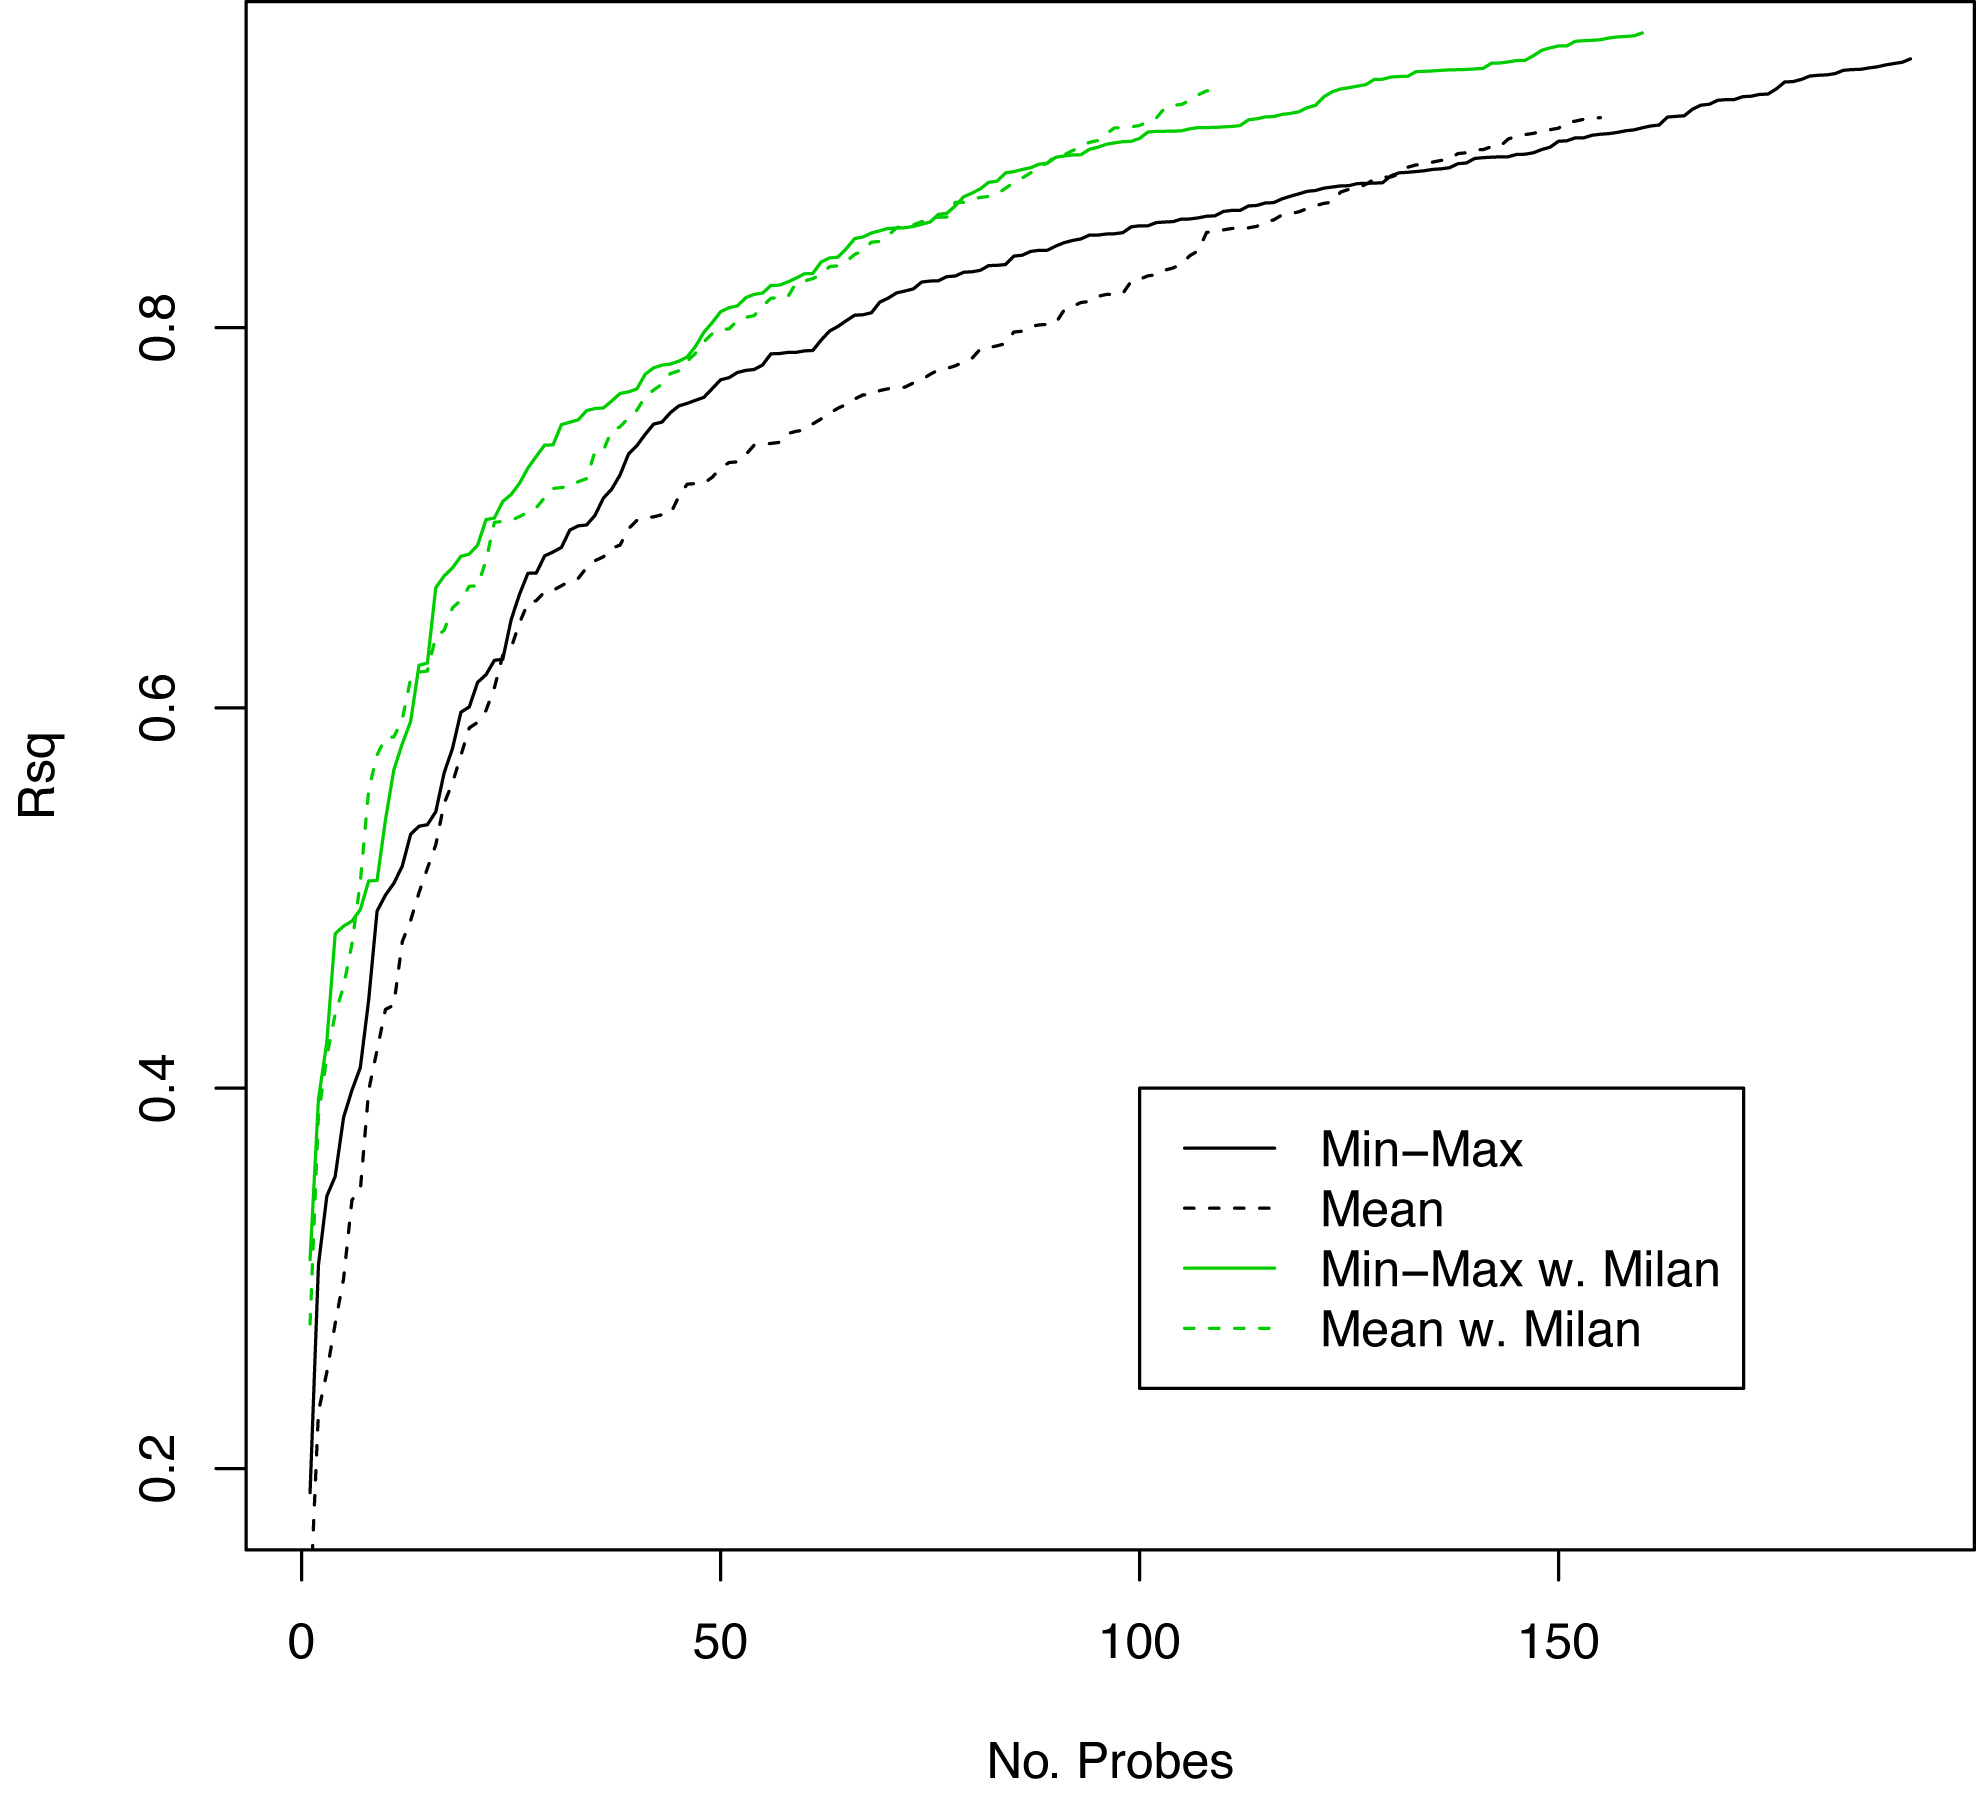
Figure S5. R squared values (y-axis) versus number of probes (x-axis) showing performance of Min-Max versus mean miRNA expression probe reduction with and without the addition of Milan criteria.
Figure S6
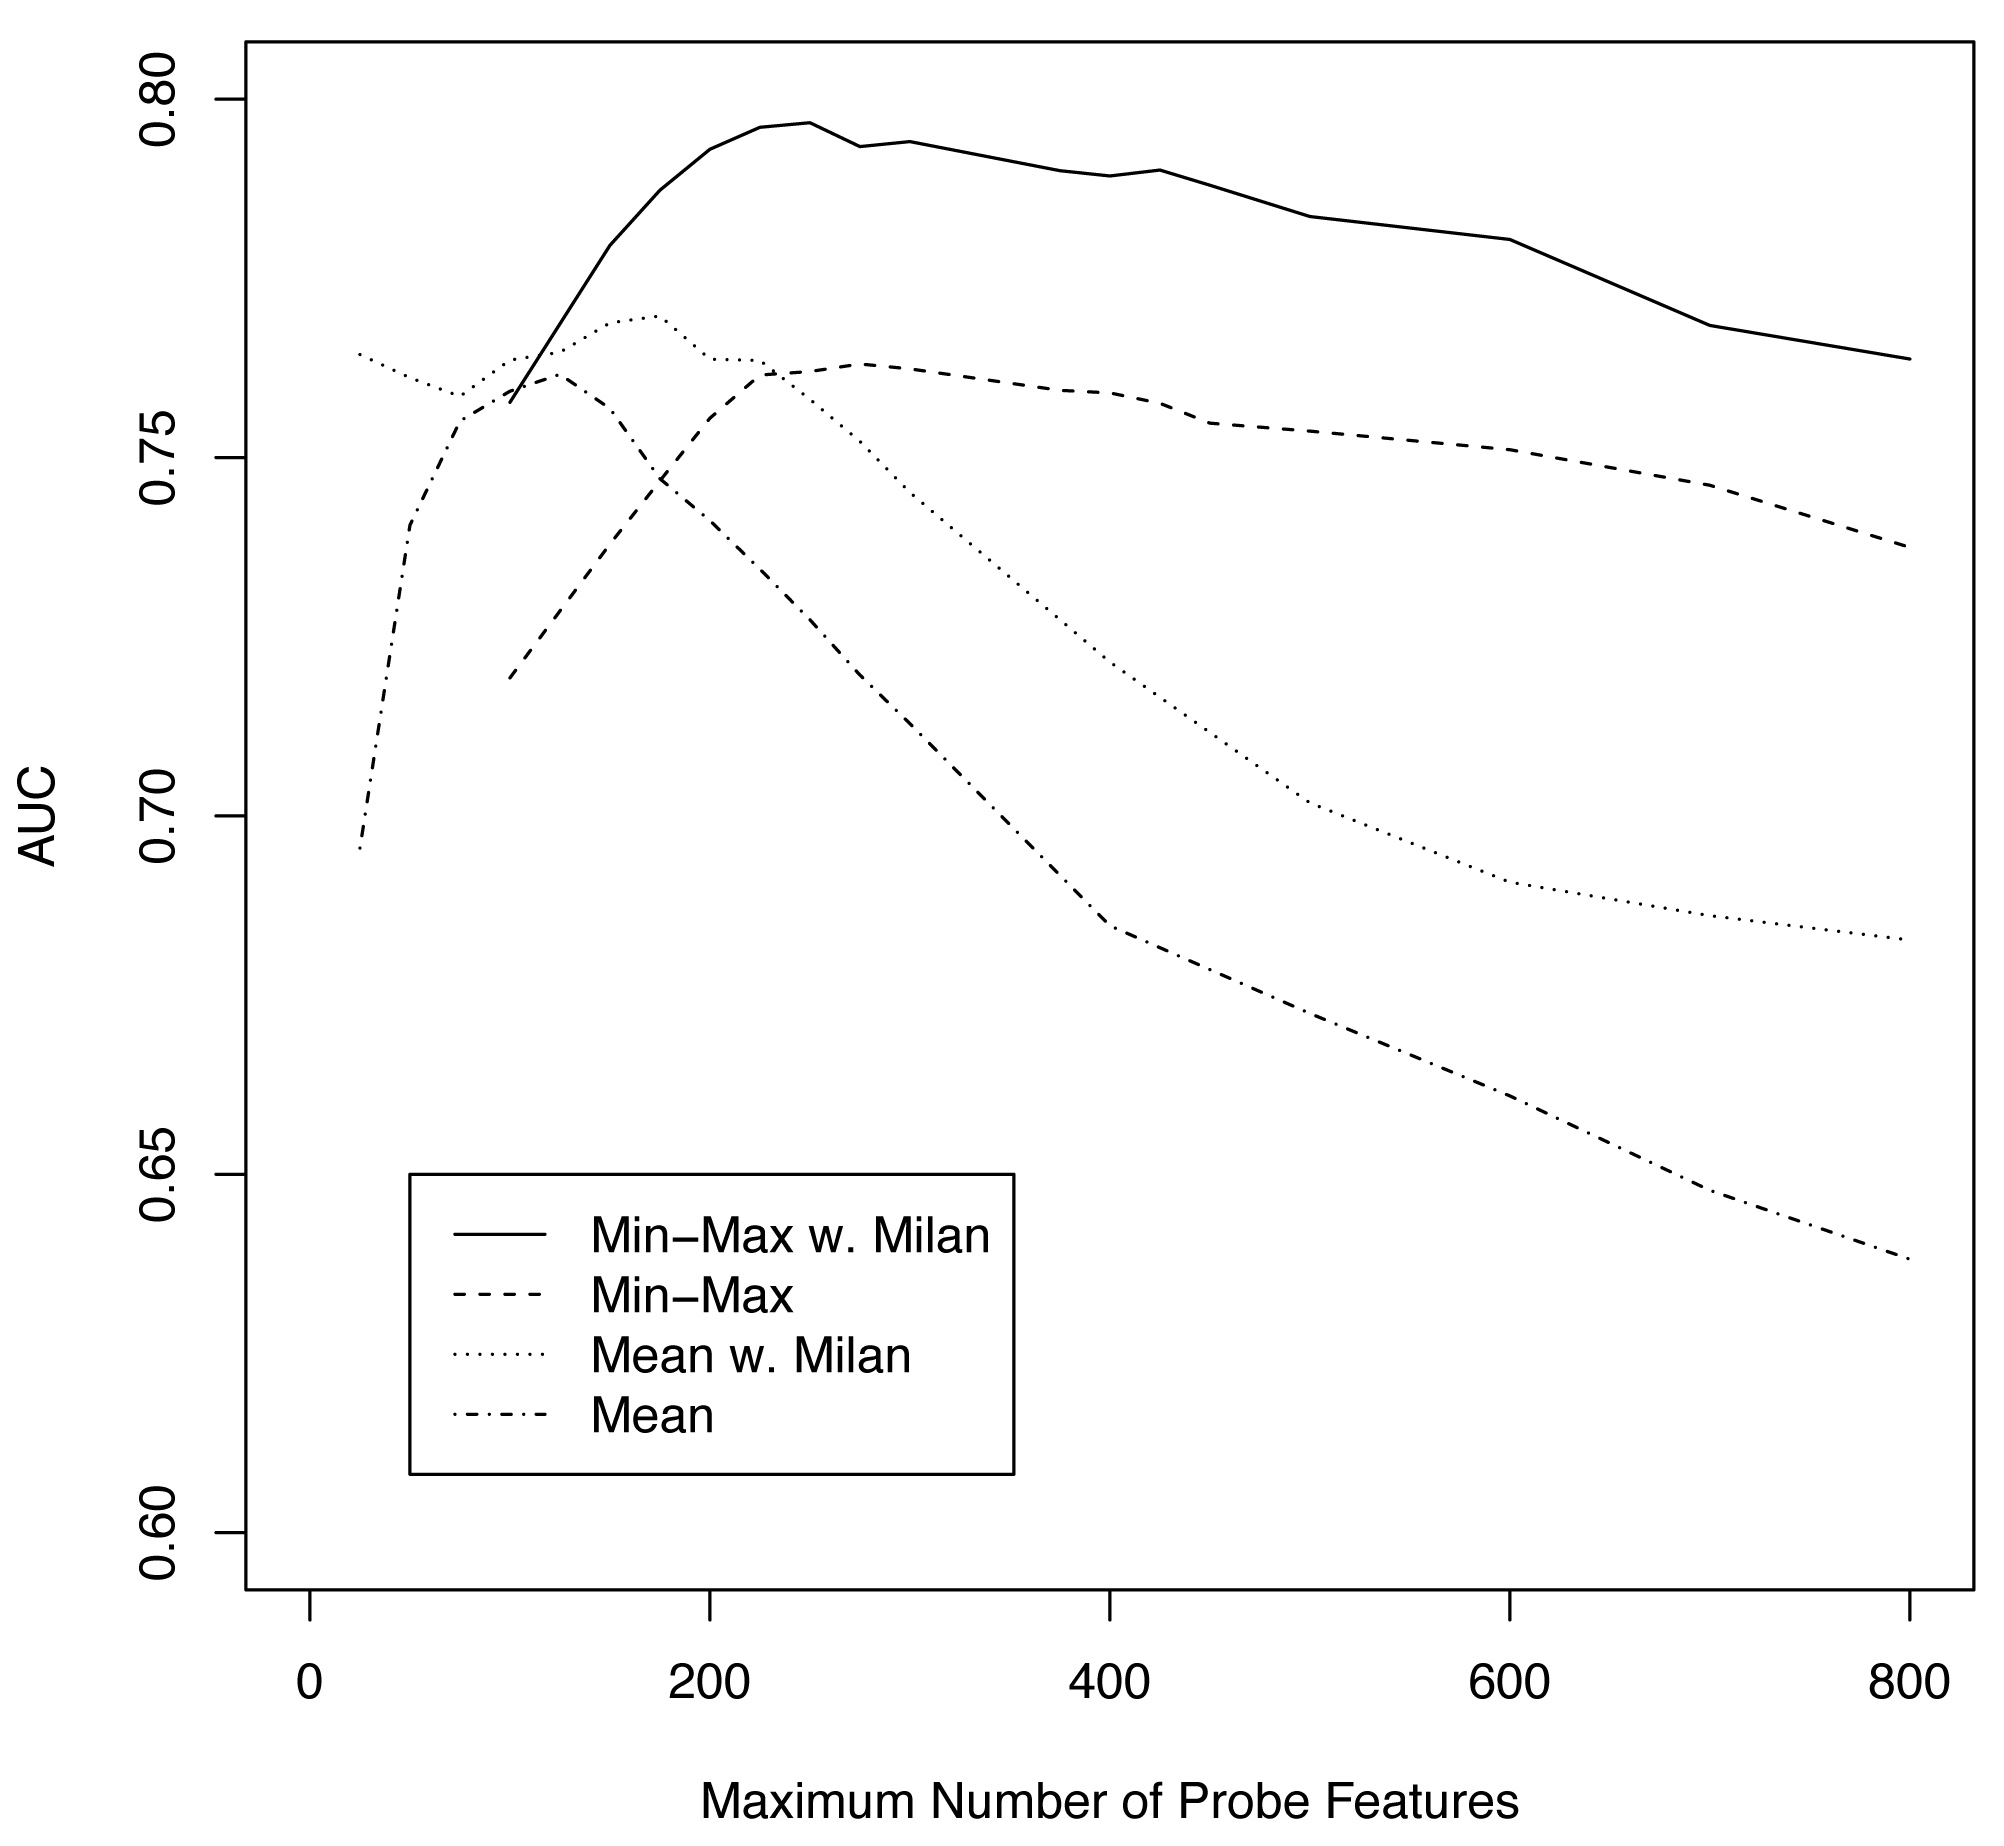
Figure S6. Cross validation procedures as a function of maximum number of probe features (M). AUC statistics for Min-Max with Milan (____), Min-Max alone (—-), mean of multifocal expression values with Milan (….), and mean alone (.-.-).
Figure S7
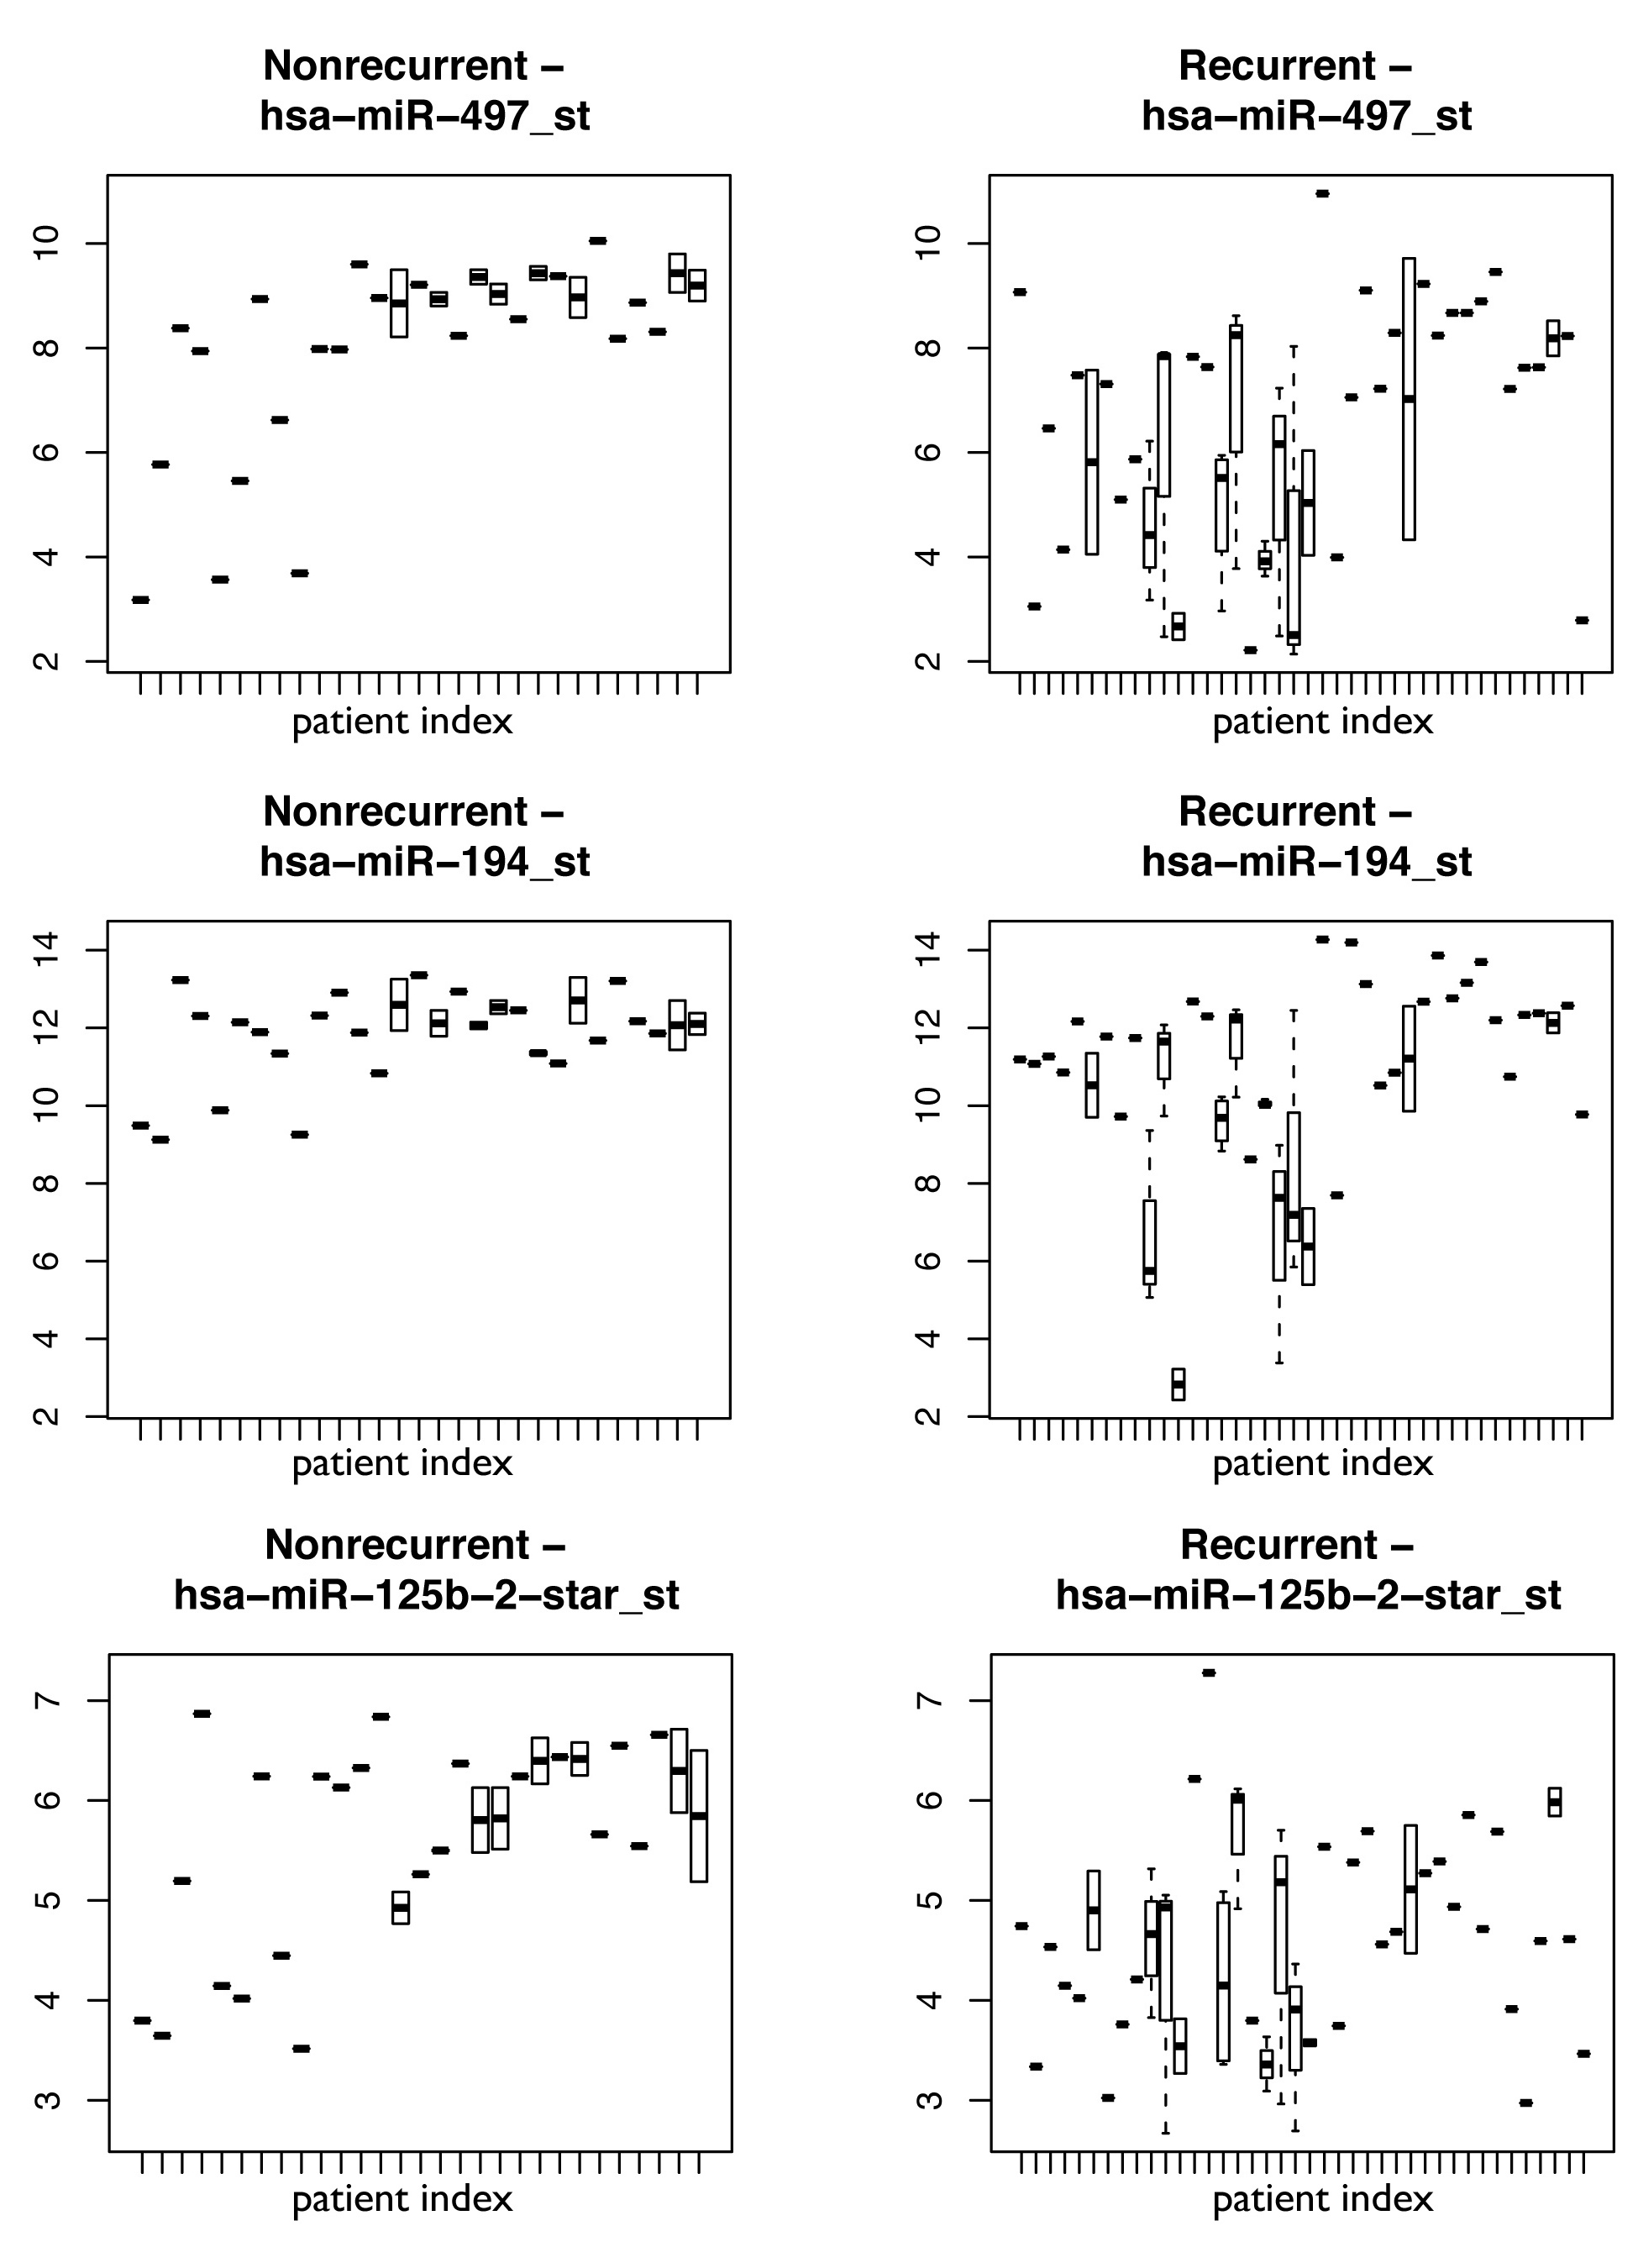
Figure S7. Plots showing expression of three representative miRNAs comprising the biomarker: 497, 194, and 125b-2-star with relative expression on the y axis and individual patients on the x axis. Boxes show the spread of expression values for that miRNA in patients with multifocal disease.

